Banner
Menu

Monthly Archives: August 2020

New Home Sales Soar, Hit 14-Year High

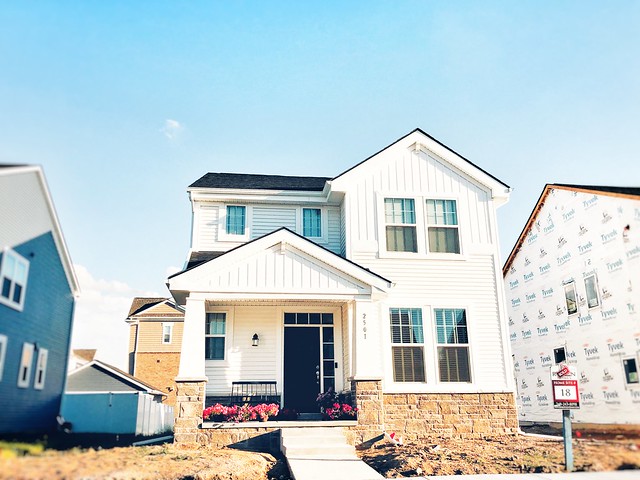
In July, sales of newly built, single-family homes soared to their highest level since 2006, according to new estimates released by the U.S. Census Bureau and the Department of Housing and Urban Development. Sales increased 13.9 percent from the month before and are now 36.3 percent higher than at the same time last year. The improvement is yet another sign that buyer demand has rebounded after initially tumbling following the coronavirus’ onset this spring. Skyrocketing new-home sales – combined with the similarly strong July existing-home sales report – make it clear that Americans have returned to the market and are eager to buy, while they can still take advantage of record-low mortgage rates. But though the long streak of low mortgage rates has helped keep affordability levels in check, buyers still face rising prices. In fact, the median sales price of new homes sold in July was $330,600, which is 7.2 percent higher than it was one year ago. The average sales price was $391,300. (source)

For-Sale

Recent Home Buyers Buy Bigger

The coronavirus pandemic has caused Americans to spend more time in their homes than they did in the past. Remote work and stay-at-home orders have kept people at home and it’s changed how they feel about their living space. Mostly, it’s caused them to dream of a bigger house. The proof is in the numbers. For example, according to one recent analysis, the typical home sold over the past 30 days has been 3.7 percent bigger than the typical home sold during the same period one year ago. And while 3.7 percent may not seem like that much, the average year-over-year growth rate between 2015 and 2019 was just 0.4 percent. Additionally, sales of larger homes were up 21 percent year-over-year in July, nearly 10 times the growth rate for smaller homes. In short, home buyers are focused on finding more space and it’s starting to show up in the data. But while sales of bigger houses have spiked, their prices haven’t. Small and medium-sized homes are still seeing faster price increases compared to larger homes. (source)

Mortgage Rates Unchanged, Still Near Record Lows

According to the Mortgage Bankers Association’s Weekly Applications Survey, average mortgage rates were mostly flat last week, remaining near all-time survey lows. Rates for 30-year fixed-rate loans and 15-year fixed-rate loans fell from the week before, while jumbo loans and loans backed by the Federal Housing Administration were unchanged from the previous week. Despite low rates, however, refinance demand decreased from one week earlier. Purchase application demand, on the other hand, was virtually unchanged from the previous week and is now 33 percent higher than at the same time last year. Joel Kan, MBA’s associate vice president of economic and industry forecasting, says the purchase market has been a bright spot. “The home purchase market remains a bright spot for the overall economy,” Kan said. “Purchase applications were essentially unchanged but were 33 percent higher than a year ago – the 14th straight week of year-over-year gains. Mortgage rates at record lows and households looking for more space are driving this summer’s surge in demand.” The MBA’s weekly survey has been conducted since 1990 and covers 75 percent of all retail residential mortgage applications.

Price Index Finds Home Values Up 4.3%

The S&P Case-Shiller Home Price Indices have been tracking home prices for more than 30 years and are considered among the leading measures of U.S. home values. According to the latest release – which contains data through the end of June – home prices are up 4.3 percent over last year at the same time. But while prices continue to increase, they are doing so at a slower pace. In fact, June’s increase was flat from the month before and both the 10- and 20-City Composites saw declines. Craig J. Lazzara, managing director and global head of index investment strategy at S&P Dow Jones Indices, says prices are stable, but the long-term trend remains to be seen. “Housing prices were stable in June,” Lazzara said. “The National Composite Index rose by 4.3 percent in June 2020, as it had also done in May … More data will be required to understand whether the market resumes its previous path of accelerating prices, continues to decelerate, or remains stable. That said, it’s important to bear in mind that deceleration is quite different from an environment in which prices actually fall.” According to the data, Phoenix, Seattle, and Tampa saw the biggest price gains year-over-year. (source)

Homes For Sale Are Selling Fast This Summer

Before the coronavirus’ onset in mid-March, most industry analysts were forecasting a hot housing market this year. Buyer demand was up and the inventory of homes for sale was lower than normal. Inevitably, that combination would lead to homes selling quickly, competition among buyers, bidding wars, and price increases. But then the pandemic took hold and many economists pulled back and adjusted their outlook for what seemed like it’d be an enormous obstacle for hopeful home buyers and sellers this year. Fortunately, though, the housing market bounced back quicker than expected. In fact, according to one recent report, the summer market now looks even hotter than originally forecast. For example, according to the release, homes for sale this summer are selling at a faster pace than at any point in the past two years. In July, homes that sold were typically under contract in just 16 days. That’s two days faster than the previous monthly low reached in January 2018. In short, the virus led already-low inventory to drop even further, which has caused competition for available homes to heat up. That means, prospective buyers should be prepared to act fast when they find a home that suits their needs and lifestyle. (source)

New Single-Family Homes Have Gotten Smaller

What we consider a big house changes over time. Someone in 1910, for example, would have a very different idea about how much living space was necessary than we do today. But while the average new home generally gets bigger over time – it grew by about 1,000 square feet between 1970 and 2015 – in recent years, it’s started to level off. In fact, according to a new analysis from the National Association of Home Builders, the average square footage of a new single-family home fell to 2,458 square feet during the second quarter of this year. By comparison, it was at an all-time high of 2,687 square feet five years ago. So what’s happening? Well, it’s pretty simple actually. Following the housing crash and financial crisis, high-end home buyers returned to the market first, driving average home size higher. As the economy recovered, however, there was a greater need for smaller, more affordable homes. So, home builders have been focused on adding entry-level inventory to the market. That’s caused average home size to dip in recent years. But while new homes have been getting smaller over the past few years, the NAHB expects the pandemic to shift buyer preferences and cause homes to start growing larger again in the near future. (source)

Purchase Loan Demand Up 27% From Last Year

According to the Mortgage Bankers Association’s Weekly Applications Survey, demand for loans to buy homes is now 27 percent higher than at the same time last year. The improvement – which comes following a 1 percent week-over-week increase – marks three consecutive months of gains over last year’s numbers. Joel Kan, MBA’s associate vice president of economic and industry forecasting, says the housing market’s quick rebound has been a bright spot in the economy. “The housing market remains a bright spot in the current economic recovery and these results, combined with July data on housing starts and home builder optimism, suggest that housing supply could be increasing to better meet the strong demand for buying a home,” Kan said. Also in the report, average mortgage rates were up from the previous week, with increases for 30-year fixed-rate loans with conforming and jumbo balances and 15-year fixed-rate loans. Rates for loans backed by the Federal Housing Administration were down from one week earlier. The MBA’s weekly survey has been conducted since 1990 and covers 75 percent of all retail residential mortgage applications.

Are Home Prices Rising Faster In Rural Areas?

In the spring, when the coronavirus had just begun to spread, there were some indication that prospective home buyers were already adjusting their plans. Buyer surveys and online search data showed there were a significant number of home shoppers who – driven primarily by the availability of remote work – decided to expand their search and look at homes in suburban and rural areas, further from the city. For example, one analysis found that the percentage of prospective buyers who said they planned to search for a home in a rural area increased from 9 percent to 19 percent following the onset of the pandemic. But what, if anything, has the interest in smaller, less populated locations done to home prices in those areas? Well, recent data shows it may have caused prices to rise more quickly. In fact, homes in rural areas saw their median sales price increase 11.3 percent year-over-year through the week ending August 2. For comparison, suburban homes were up 9.2 percent and urban areas saw a 6.7 percent annual increase. (source)

Builder Confidence Rebounds To All-Time High

The National Association of Home Builders’ Housing Market Index measures builder confidence in the market for newly built single-family homes. The survey, which has been conducted for the past 35 years, scores builders’ responses on a scale where any number above 50 indicates more builders view conditions as good than poor. In August, the index reached a score of 78, which matches its all-time high set in 1998. Robert Dietz, NAHB’s chief economist, says the housing market’s rebound has been a bright spot during the pandemic. “Housing has clearly been a bright spot during the pandemic and the sharp rebound in builder confidence over the summer has led NAHB to upgrade its forecast for single-family starts, which are now projected to show only a slight decline for 2020,” Dietz said. “Single-family construction is benefiting from low interest rates and a noticeable suburban shift in housing demand to suburbs, exurbs, and rural markets as renters and buyers seek out more affordable, lower density markets.” Among its components, the gauge of current buyer traffic showed the biggest month-over-month improvement, rising eight points to 65 – its highest level ever. (source)

Majority Of Recently Sold Homes Were Affordable

If you’re considering buying a home, you’ve likely already thought about whether or not you can afford it. After all, buying a home is a major financial transaction, so there are few considerations more important than affordability. That’s why the National Association of Home Builders latest Housing Opportunity Index is good news for potential buyers. The report – which measures how affordable homes are for families earning the national median income – found that 59.6 percent of new and existing home sold between April and June were affordable. But while that’s positive news, affordability did fall from the first quarter, with the number of affordable homes down due to rising home prices. “Home prices appreciated robustly during the second quarter due to better-than-expected housing demand in the wake of the pandemic and because the coronavirus hindered the ability of builders to ramp up production,” Robert Dietz, NAHB’s chief economist, said. In fact, increasing prices let to a 1.7 percent drop in the number of affordable homes. During the first quarter, 61.3 percent of sold homes were considered affordable.

Thank you for your upload