

Banner
Menu

Category: Uncategorized

Builder Confidence In New Home Market Still High


The market for newly built single-family homes is an important barometer of the housing market’s health overall. Because of this, the National Association of Home Builders surveys builders each month and asks for their perception of current sales conditions, buyer traffic, and expectations for the next six months. The Index is measured on a scale where any number above 50 indicates more builders view conditions as good than poor. In November, it fell three points to 62. But despite the month-over-month decline, the Index has now been above 60 for six consecutive months and, according to NAHB’s chief economist, David Crowe, the real estate market is headed for continued improvement. “The November report is pullback from an unusually high October, and is more in line with the consistent, modest growth that we have seen throughout the year,†Crowe said. “A firming economy, continued job creation, and affordable mortgage rates should keep housing on an upward trajectory as we approach 2016.†Regionally, three-month moving averages show all four regions in positive territory. The West increased four points to 70, while the Northeast reached 50 after a three point gain. The Midwest and South were unchanged at 60 and 65, respectively. More here.
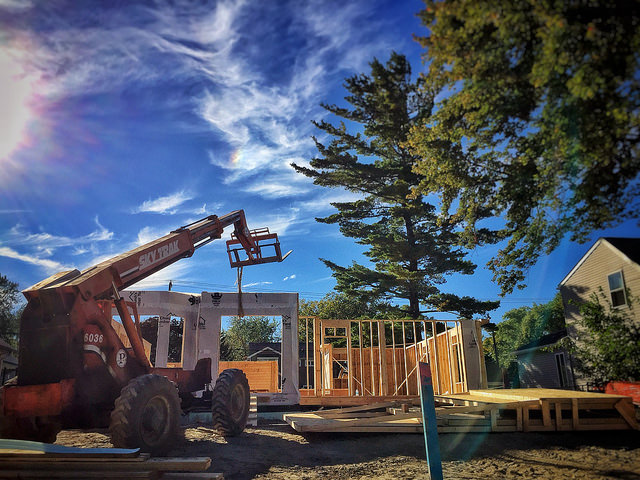

Construction equipment lifting a worker to build a wooden frame structure outdoors.

Mortgage Credit Availability Improves Again


When mortgage credit is tight, it’s harder for prospective home buyers to secure financing. That means, fewer potential buyers will qualify for home loans and fewer homes will be sold. Fortunately, data from the Mortgage Bankers Association, shows mortgage credit has been loosening and the trend continued in October. In fact, the Mortgage Credit Availability Index – which is scored in such a way that any increase indicates credit is loosening, while a decline signals that lending standards are tightening – increased 1.5 percent from the month before. Mike Fratantoni, MBA’s chief economist, said October’s results are partly due to new loan programs. “Credit availability increased in October mainly as a result of new conforming loan programs, many of which were affordable housing programs which have lower down payment requirements,†Fratantoni said. A closer look at the numbers reveals that conforming loans did see the biggest increase, rising 2.7 percent over September. However, all loan categories loosened from the month before including loans backed by the Federal Housing Administration, as well as conventional and jumbo mortgages. More here.

A collage of torn U.S. dollar bills arranged on a surface.

Foreclosure Starts Jump In October


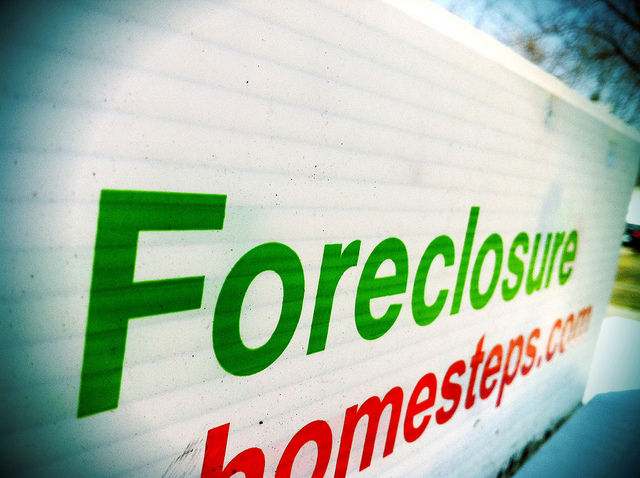
The number of foreclosure starts saw its biggest monthly increase since 2011, according to recently released data from RealtyTrac’s U.S. Foreclosure Market Report for October. The 12 percent spike follows a pattern seen in previous Octobers but the size of the increase was significant. “We’ve seen a seasonal increase in foreclosure starts in October for the past five consecutive years, so it’s not too surprising to see the monthly increase this October,†Daren Blomquist, vice president at RealtyTrac, said. “However, the 12 percent increase this October is more than double the average 5 percent monthly increase in the past five Octobers, and the even more dramatic monthly increases in some states is certainly a concern.†Despite the month-over-month spike, overall foreclosure filings – which include default notices, schedules auctions, and bank repossessions – are still down from one year ago and foreclosure starts, specifically, are down 14 percent from the same point last year. The upward trend, according to Blomquist, could be the result of a number of factors including some long-term delinquencies that are just now entering the foreclosure pipeline or, in other cases, economic uncertainty may be driving more distress. Foreclosure rates were highest in Maryland, New Jersey, Florida, Nevada, and Illinois. More here.

Close-up of a foreclosure sign with website information.

Mortgage Rates Rise For 3rd Straight Week

According to the Mortgage Bankers Association’s Weekly Applications Survey, average mortgage rates increased across all loan categories last week, including 30-year fixed-rate mortgages with both conforming and jumbo balances, loans backed by the Federal Housing Administration, and 15-year fixed-rate loans. Last week’s rate increase continues a recent upward trend that is powered by a stronger economy and significantly improved employment picture. It is also partly driven by expectations that the Federal Reserve may raise interest rates in December. Mike Fratantoni, MBA’s chief economist, told CNBC, “Mortgage rates were up for the third-consecutive week as markets responded to a stronger-than-expected job market report for October.” But despite the rate increase, demand for mortgage applications fell less than expected. In fact, purchase application demand was essentially flat from the week before and refinance activity, which tends to be more sensitive to rate fluctuations, fell just 2 percent. The MBA’s weekly survey has been conducted since 1990 and covers 75 percent of all retail residential mortgage applications. More here.

Mortgage 1

Market Strong Among Baby Boomer Buyers


The residential real estate market is booming among buyers 55 and older, according to the most recent 55+ Housing Market Index from the National Association of Home Builders. The index – which measures builders’ perceptions of current sales, prospective buyer traffic, and their expectations for the next six months – is scored on a scale where any number above 50 indicates more builders view conditions as good than poor. Third quarter results show a reading of 60, up three points from the previous quarter. David Crowe, NAHB’s chief economist, says the market among baby boomers is strong and should continue to grow. “Like the overall housing market, we continue to see steady, positive growth in the 55+ market,†Crowe said. “With the economy and job growth continuing to improve gradually, many consumers are now able to sell their current homes at a suitable price, enabling them to buy or rent in a 55+ community.†This trend, driven by the price increases of the past few years, helps boost home sales but also works to moderate future price increases as more current homeowners put their homes up for sale, building for-sale inventory, and balancing the market. More here.

Palm trees and a white house under a clear blue sky.

Potential Buyers Feeling Confident But Cautious

Americans feel confident they’re in no danger of losing their jobs but have cooled a bit on the idea of buying a house, according to the most recent results of Fannie Mae’s monthly Home Purchase Sentiment Index. The survey – which asks Americans about their attitudes toward owning a home, price changes, the economy, their finances and more – was virtually flat from the month before but saw a slight decrease in the number of respondents who said now was a good time to buy a home. Doug Duncan, Fannie Mae’s senior vice president and chief economist, said, though Americans feel secure in their jobs, their incomes aren’t growing. “The income growth necessary for renewed momentum in housing market sentiment remains elusive, even though consumers’ confidence in their job security continues to strengthen,” Duncan said. “Consumers’ net view on whether their household income has improved over the last year is down once again this month.” Still, despite the fact that consumers have become slightly more hesitant, the overall index remains near its highest level of the past four years and all indications point to continued strength through the end of the year and into 2016. More here.

Roofline

Repeat Home Buyers Driving Sales Gains


The National Association of Realtors’ 2015 Profile of Home Buyers and Sellers is a survey that measures the preferences, motivations, and demographics of recent buyers and sellers. According to the results, the increased number of home sales this year has largely been driven by repeat buyers who used the sale of their current home to come up with a down payment on a new house. In fact, 53 percent of repeat buyers used the money they made selling their home as the main source of their down payment. That represents a 6 percent increase over last year and a 13 percent increase from 2012. It also explains a lot about the demographic breakdown of recent home buyers. For example, there has been a smaller share of first-time home buyers active in the market over the past few years. Historically, first timers account for about 40 percent of home sales. This year, they made up just 32 percent. With improved employment conditions and a strengthening housing market, there was an expectation that they would be more active this year. But, according to Lawrence Yun, NAR’s chief economist, debt is the reason young Americans aren’t buying. “First-time buyers reported that debt (all forms) delayed saving for a down payment for a median of three years, and among the 25 percent who said saving was the most difficult task, a majority (58 percent) said student loans delayed saving,†Yun said. More here.

Sold

Average Seller Sees 17% Gain On Purchase Price


New estimates from RealtyTrac show that the average homeowner who sold during the third quarter of this year saw a price gain of $40,658 over the amount they paid for their home. That’s a 17 percent improvement and the highest average price gain for home sellers in eight years. According to the Q3 2015 U.S. Home Sales Report, third-quarter home sellers owned their home for an average of 6.72 years before selling. Daren Blomquist, RealtyTrac’s vice president, says the gains may be the result of homeowners who have waited to sell while home prices recovered over the past few years. “An increasing number of homeowners in 2015 have been cashing out the home equity they’ve gained during the housing recovery of the past three years,†Blomquist said. “That may be a good decision because the data points to a plateauing market going forward.†In fact, the report shows that home prices are up just 2.4 percent from the previous year, with an average sale price for single-family homes and condos reaching $263,976 during the quarter. That’s the slowest year-over-year improvement since the first quarter of 2012. More  here.

Close-up of a hundred-dollar bill showing detailed engraving.

Mortgage Demand Flat As Rates Move Up


According to the Mortgage Bankers Association’s Weekly Applications Survey, average mortgage rates moved up last week across all loan categories, including 30-year fixed-rate mortgages with both conforming and jumbo balances, loans backed by the Federal Housing Administration, and 15-year fixed-rate loans. It was the second consecutive week mortgage rates rose. The increase caused demand for mortgage applications to fall from the previous week’s level. In fact, the Market Composite Index – which measures both refinance and purchase activity – fell 0.8 percent from the week before, with both the Refinance and Purchase Index registering a 1 percent decline. Despite the drop, however, demand for loans to purchase homes was still 20 percent higher than one year earlier. That improvement points to a significant increase in home sales over last year. Since mortgage application demand is an important indicator of future housing demand, any increase in the number of purchase loans indicates sales will also rise. The MBA’s weekly survey has been conducted since 1990 and covers 75 percent of all retail residential mortgage applications. More here.

A bold red arrow pointing upwards.

Price Growth Presents Opportunity For Buyers


A new report from Clear Capital looks at the rate at which prices are increasing and compares the year-over-year growth at both the high and low ends of the market. The results show that home prices are rising faster on the low-end of the market than they are at the top. That means, lower priced homes are seeing continued price appreciation, while higher priced homes have seen prices begin to level off. Alex Villacorta, vice president of research and analytics at Clear Capital, says this should signal an opportunity for first-time home buyers and investors. “As the housing recovery continues to unfold, we are clearly seeing a growing dichotomy between the low-price tier and top-price tier market performance,†Villacorta said. “By and large, the low-price tiers of the top and bottom MSAs are significantly outperforming their top-tier counterparts.†In fact, areas with a large number of distressed properties are seeing price growth at the low end of the market outpacing the top tier by as much as 20 percent. One explanation for this could be that higher-priced homes saw smaller price declines during the housing crash and, therefore, rebounded more quickly than homes at the lower-end of the market. More here.

A dollar sign on a white sign with electrical plug prongs above it.

Thank you for your upload