Banner
Menu

Tag: Property management NYC

Older Home Buyers May Ignite Housing Boom


Baby boomers are reaching retirement age and many of them have expressed a desire to move from their current home. Whether they’re downsizing or buying their dream house in another state, what these boomers do in retirement will have an effect on the housing market over the next several years. Because of this, the National Association of Home Builders saw a big end-of-the-year jump in their quarterly 55+ Housing Market Index. In fact, during the fourth quarter of last year, the index – which measures builders’ confidence in the market among buyers over the age of 55 – reached its highest level since the survey began in 2008. Dennis Cunningham, chairman of the NAHB’s 55+ Industry Council, says some of the optimism was due to the November election but demographics also play a large role. “Builders and developers in this market segment are also encouraged by the fact that for the next 15 years, 10,000 baby boomers will be turning 65 every day,†Cunningham said. “The consistent pressure of this age group wanting to downsize from a large home, shifting to other regions of the country or just simply looking for a newer home or community also plays a key role in the index movement.†More here.

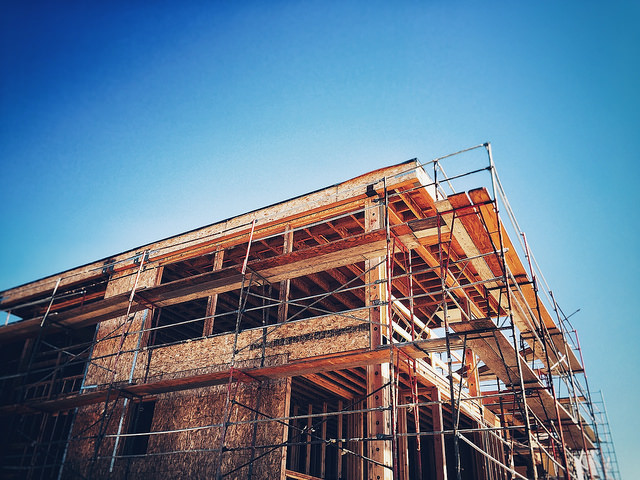
Wooden framework of a building under construction against a clear blue sky.

How Long Does It Take To Break Even On A House?


Conventional wisdom says, after buying a house, you should stay there at least five years before selling. The reason is that, due to the substantial upfront costs of buying a home – including the down payment, closing costs, etc. – you need to allow yourself some time to build up equity in order to recoup that money. However, the exact amount of time it takes to break even will vary from market to market. After all, home values don’t rise at the same exact rate in every town across the country. In fact, according to Zillow’s Q4 2016 Breakeven Horizon report, the typical break even point can be anywhere from just under a year and a half to over five years, depending on where you live. For example, home buyers break even fastest in markets in the South and Midwest, such as Indianapolis, Orlando, Detroit, Atlanta, and Tampa. On the other end of the spectrum, California homeowners have the longest break even points. Buyers in cities like San Jose, San Francisco, Los Angeles, and San Diego should expect to stay in a house at least four years before they break even. Of course, there are a lot of factors that go into determining how long it’ll be before you have enough equity in your house to make back the money you put down to purchase it. But with the national average at just under two years, planning on staying in your home for five years seems like a safe bet. More here.

Close-up of a 1999 US penny featuring Abraham Lincoln.

Mortgage Rates Moved Higher Last Week


According to the Mortgage Bankers Association’s Weekly Applications Survey, mortgage interest rates moved up last week. Rates increased for 30-year fixed-rate loans with both jumbo and conforming balances, as well as 15-year fixed-rate mortgages. Loans backed by the Federal Housing Administration saw rates flat from the week before. The rate increase contributed to a 3.2 percent drop in the number of Americans requesting applications for loans last week. Another reason for the drop in demand, according to MBA chief economist, Michael Fratantoni, was changes to a proposal that would’ve reduced mortgage insurance premiums on FHA loans. “Following the decision to suspend a proposed decrease in the FHA mortgage insurance premium, FHA refinance applications dropped more than 25 percent, while FHA purchase applications fell almost 6 percent,†Fratantoni told CNBC. Still, even with last week’s decline, the number of applications for loans to buy homes remains higher than it was last year at the same time and Fratantoni continues to believe home sales this year will exceed last year’s levels. The MBA’s weekly survey has been conducted since 1990 and covers 75 percent of all retail residential mortgage applications. More here.

Close-up of an upward arrow key on a keyboard.

Home Price Index Shows Continued Gains


Home prices were up 5.6 percent year-over-year, according to the latest results from the S&P CoreLogic Case-Shiller U.S. National Home Price Indices. Considered the leading measure of U.S. home values, the index found prices relatively flat month-over-month but up on an annual basis. Seattle, Portland, and Denver reported the sharpest increases but, in total, eight of the 20 included cities saw greater gains than they did over the same period one year earlier. David M. Blitzer, managing director and chairman of the index committee at S&P Dow Jones Indices, says home prices have fully recovered after years of volatility. “With the S&P CoreLogic Case-Shiller National Home Price Index rising at about 5.5 percent annual rate over the last two-and-a-half years and having reached a new all-time high recently, one can argue that housing has recovered from the boom-bust cycle that began a dozen years ago,†Blitzer said in a press release. “The recovery has been supported by a few economic factors: low interest rates, falling unemployment, and consistent gains in per-capita disposable personal income.†Blitzer added that continued personal income and employment gains could boost demand for housing even further this year. More here.

Text reading 'PRICES' on a reflective glass surface.

Pending Home Sales Rise In December


When a buyer signs a contract to purchase a home, it is referred to as a pending sale because it usually takes a few weeks before the transaction closes and the house is considered officially sold. Since most of these transactions end in a sold house, the National Association of Realtors tracks them as a way of predicting the number of final sales that will be seen in coming months. In December, the NAR found pending sales up 1.6 percent from the month before. Lawrence Yun, NAR’s chief economist, says the year ended on a high note. “Pending sales rebounded last month as enough buyers fended off rising mortgage rates and alarmingly low inventory levels to sign a contract,†Yun said. “The main storyline in the early months of 2017 will be if supply can meaningfully increase to keep price growth at a moderate enough level for households to absorb higher borrowing costs.†Yun also points out that home sales figures vary depending on the price of the house. For example, sales of homes above $250,000 were up 10 percent over the year before in December. By comparison, sales of homes under $100,000 fell 11.6 percent. This indicates that there are more homes for sale at the higher end of the market than there are at more affordable levels. However, an expected increase in the number of new homes built this year could help balance the market, offering buyers more choices and helping to moderate future price increases on existing homes.

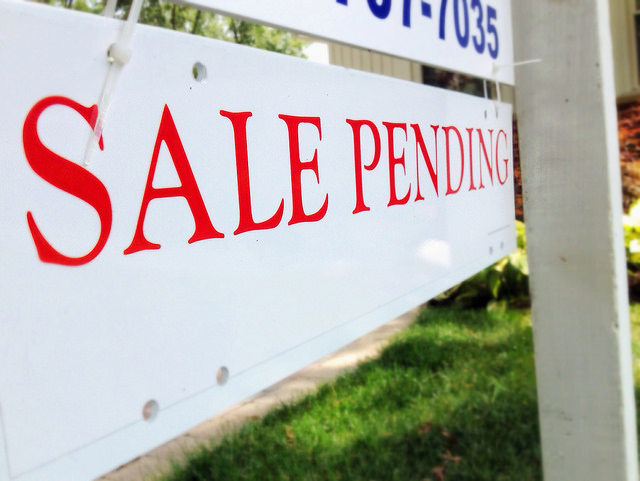
Close-up of a 'Sale Pending' sign in a grassy outdoor setting.

House Payment Less Than Rent In Most Markets


An analysis of data from the U.S. Department of Housing and Urban Development and the Bureau of Labor Statistics found that a monthly house payment – including mortgage, property taxes, and insurance – is more affordable than rent in 66 percent of the 540 counties included in the report. The 2017 Rental Affordability Report, released by ATTOM Data Solutions, shows that buying a house remains an affordable choice for Americans in most markets. Daren Blomquist, senior vice president of ATTOM, says that can change quickly, however. “While buying continues to be more affordable than renting in the majority of U.S. markets, that equation could change quickly if mortgage rates keep rising in 2017,†Blomquist said. “In that scenario, renters who have not yet made the leap to homeownership will find it even more difficult to make the leap this year.†Still, rent is rising faster than home prices in nearly 40 percent of U.S. housing markets, which could make the choice between buying and renting a close call even with higher mortgage rates. To gauge the affordability of renting versus buying, the report compared fair market rent on a three-bedroom property to the monthly house payment on a median-priced home in the 540 counties with more than 900 home sales. More here.

Close-up of George Washington's portrait on U.S. currency.

New Home Sales Rose 12.2% Last Year


The number of new homes sold last year was 12.2 percent higher than it was the year before, according to new estimates released by the U.S. Census Bureau and the Department of Housing and Urban Development. The numbers show an estimated 563,000 new homes were sold in 2016, compared to 501,000 one year earlier. Still, much like the recently released existing-home sales data, the report also shows sales slowing at the end of the year. In fact, December sales fell 10.4 percent from November’s estimate. That is likely due to a number of factors, however – including the holiday season, rising mortgage rates at the end of the year, and the natural volatility of month-over-month sales numbers. Despite the December drop, sales still managed to have their best year since 2007 and, with builders recently expressing renewed confidence in the market, this year could see yet another improvement. Also in the report, the median price of a new house sold in December was $322,500; the average sales price was $384,000. Regionally speaking, sales were up in the Northeast but down in the Midwest, South, and West. More here.

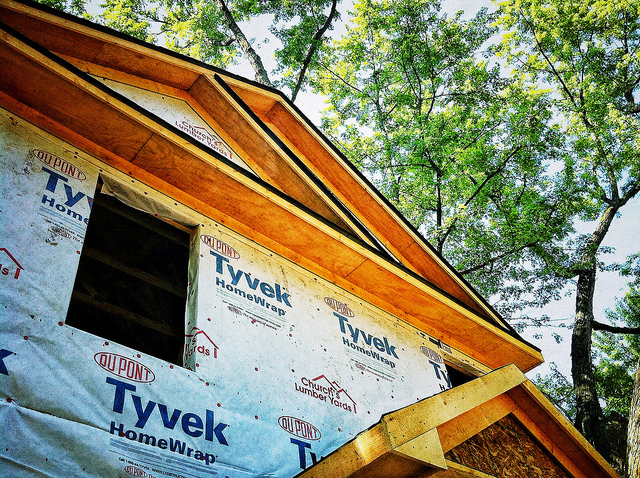
A house under construction wrapped in Tyvek HomeWrap surrounded by trees.

Home Buyers Not Deterred By Higher Rates


According to the Mortgage Bankers Association, mortgage rates increased last week but, despite higher rates, so did demand for mortgage loan applications. In fact, the number of Americans requesting applications for loans to buy homes was up 6 percent from the week before, reaching its highest level since last June. Lynn Fisher, MBA’s vice president of research and economics, said wage growth may be softening the effects of higher interest rates. “Although it is still early in the home buying season, purchase activity remains on par with a year ago, suggesting that recent wage growth of nearly 3 percent is helping to offset the increase in interest rates,†Fisher told CNBC. “This trend is also consistent with other reports of home buying activity.†Still, higher rates have slowed refinance activity, which was essentially flat from the week before. That may be due to the fact that mortgage rates rose for the first time this month and were up across all loan categories – including 30-year fixed-rate loans with both conforming and jumbo balances, 15-year loans, and loans backed by the Federal Housing Administration. The MBA’s survey has been conducted weekly since 1990 and covers 75 percent of all retail residential loan applications. More here.

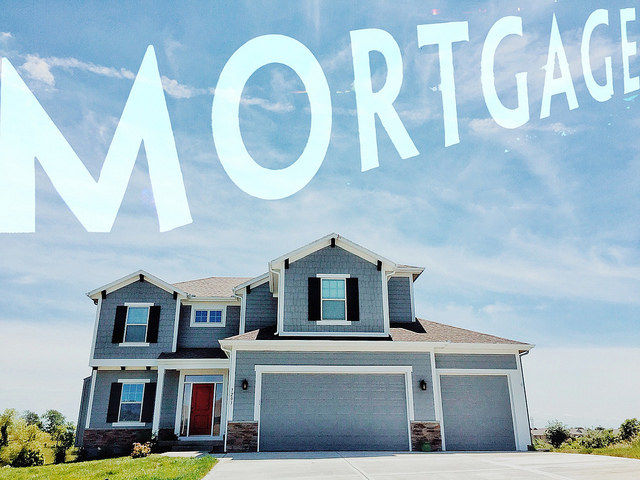
A suburban house under a sky with 'MORTGAGE' written across it.

Existing Home Sales Have Best Year Since 2006


In 2016, sales of previously owned homes reached their highest level in 10 years, according to new estimates from the National Association of Realtors. A combination of low mortgage rates and an improving economy helped push sales higher than the year before. Still, they remain about 1 million short of where they were in 2006. Lawrence Yun, NAR’s chief economist, says conditions were favorable for most of the year but December sales declined from the month before. “Solid job creation throughout 2016 and exceptionally low mortgage rates translated into a good year for the housing market,†Yun said. “However, higher mortgage rates and home prices combined with record low inventory levels stunted sales in much of the country in December.†In fact, sales were down 2.8 percent from November, though they remain 0.7 percent higher than they were a year earlier. Still, lower-than-normal inventory levels mean prices could continue to see upward pressure unless more homeowners put their homes up for sale or new home construction ramps up this year. Also in the report, home prices rose 4 percent from December 2015 and inventory has now fallen year-over-year for 19 consecutive months. More here.

Close-up of a 'For Sale' sign on a property.

How You Compare To The Typical Home Seller

The National Association of Realtors’ Profile of Home Buyers and Sellers takes an annual look at the who, what, where, and how of the year’s typical real-estate transaction. Based on a survey sent out across the country, the results reveal things like how much the average home seller made on the sale of their home, how buyers came up with their downpayment, and what types of homes sold, who sold them, and for how much. For example, last year’s typical seller was 54 years old, had been living in their home for 10 years, and had a median income of $100,700. The most commonly cited reason for selling a home was to find something bigger, which was named by 18 percent of respondents. Other common reasons for selling a home included wanting to live closer to friends and family and because of a new job. The majority of sellers didn’t have to offer any incentives in order to attract a buyer for their home and nearly 9 in 10 used a real-estate agent to help sell their house. The typical home seller was able to sell their home for $43,100 more than they purchased it for and got 98 percent of their final listing price. More here.

Thank you for your upload